
The Wise son:
Survival analysis is one of the most common analyses in the medical world. Data is usually time-to-event, and many studies’ questions are referring to the survival probabilities of two or more groups. We can use the Kaplan-Meier method to draw survival curves. However, be aware that the Kaplan-Meier yields unadjusted curves. If for example, the groups are different in age, gender and BMI distribution, one will need first to obtain the adjusted probabilities from Cox proportional hazards regression.
The Simple son:
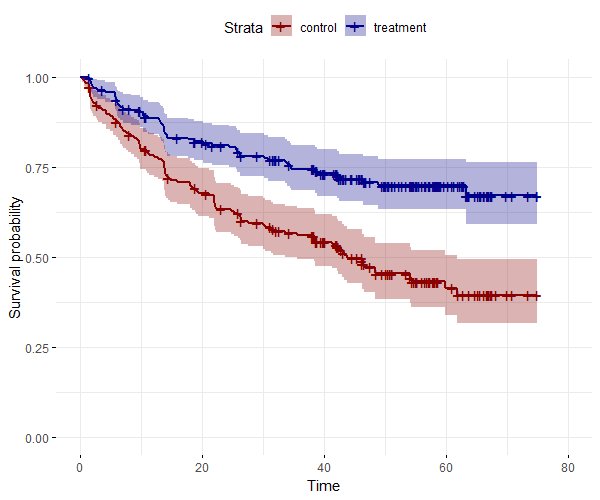
Drawing the Kaplan-Meier curves in R is very simple, just using the R::survival and R::survminer packages, and the "diabetic" data of R::survival:
data(diabetic)
fit1 <- survfit(Surv(time = time, event = status) ~ trt, data = diabetic)
ggsurvplot(fit1,
conf.int = TRUE,
legend.labs=c("control", "treatment" ),
ggtheme = theme_minimal(),
palette = c("darkred", "darkblue")
)
In order to draw the survival probabilities of a Cox multivariable regression, we first fit a cox model and then we create a new data-frame, with only two rows (one for each group), and fix all variables to the mean (if continuous) or reference level (if categorical):
#Fit the model:
fit.coxph <- coxph(Surv(time = time, event = status)~ trt+ age+ eye, data = diabetic)#Fixed data set:
df_fixed <- with(diabetic,
data.frame(
trt= c("0", "1"),
age= rep(mean(age), 2),
eye = rep("left", 2)))#Fit the model on the fixed data:
fit2 <- survfit(fit.coxph, data = diabetic, newdata = df_fixed)
ggsurvplot(fit2,
conf.int = TRUE,
legend.labs=c("control", "treatment"),
ggtheme = theme_minimal(),
palette = c("darkred", "darkblue")
)
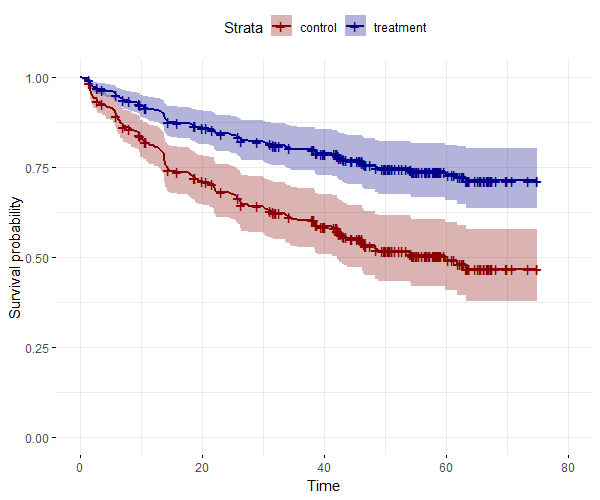
We can add: fun = "cumhaz" in order to plot the cumulative hazard function.
The Wicked son:
I bet you don’t know what the y-axis means, right? What is really “survival probability”, ha?
The Simple son:
Wicked, I think your survival probability is very low at this point, if you keep being such an a*&^. But anyway, the y-axis represents the estimated probability of being outcome-free from time t forward, given that you were outcome-free up to time t. Yes, time is the x-axis and outcome-free meaning alive or remission if the outcome is mortality or recurrent.
The Wicked son:
Good for you. And can you show me the results of the little model you did there?
The Simple son:
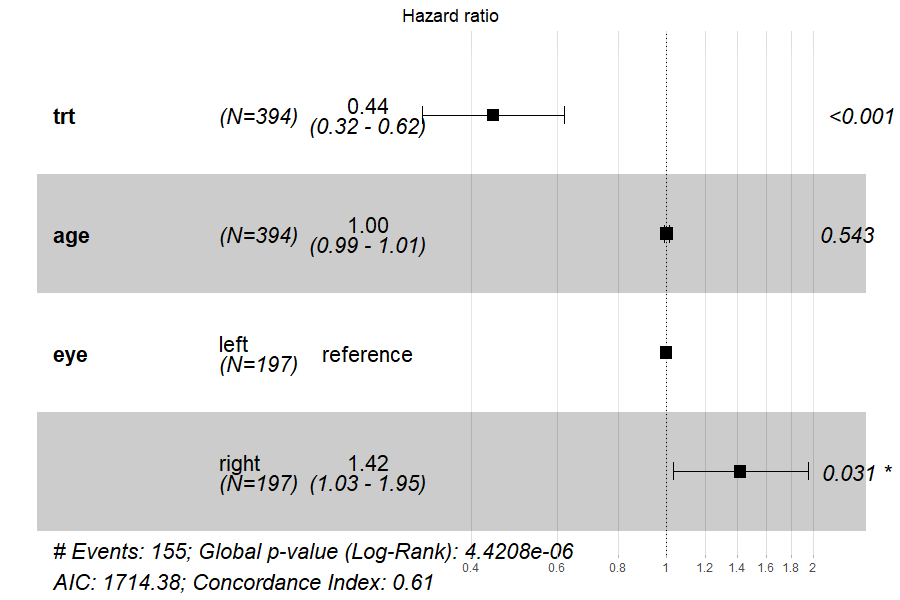
Of course. With survminer::ggforest it is very easy:
survminer::ggforest(fit.coxph, fontsize = 1.5)
He who couldn’t ask:
I wonder what is the survival probability of the strawberry pie I’ve made a week ago. At first it looked like it can survive two weeks easily, but now it looks like it has about 10% probability to survive tomorrow’s breakfast. But I assure you, it won't make you diabetic!